PULSEBOARD
Business data, at a glance.
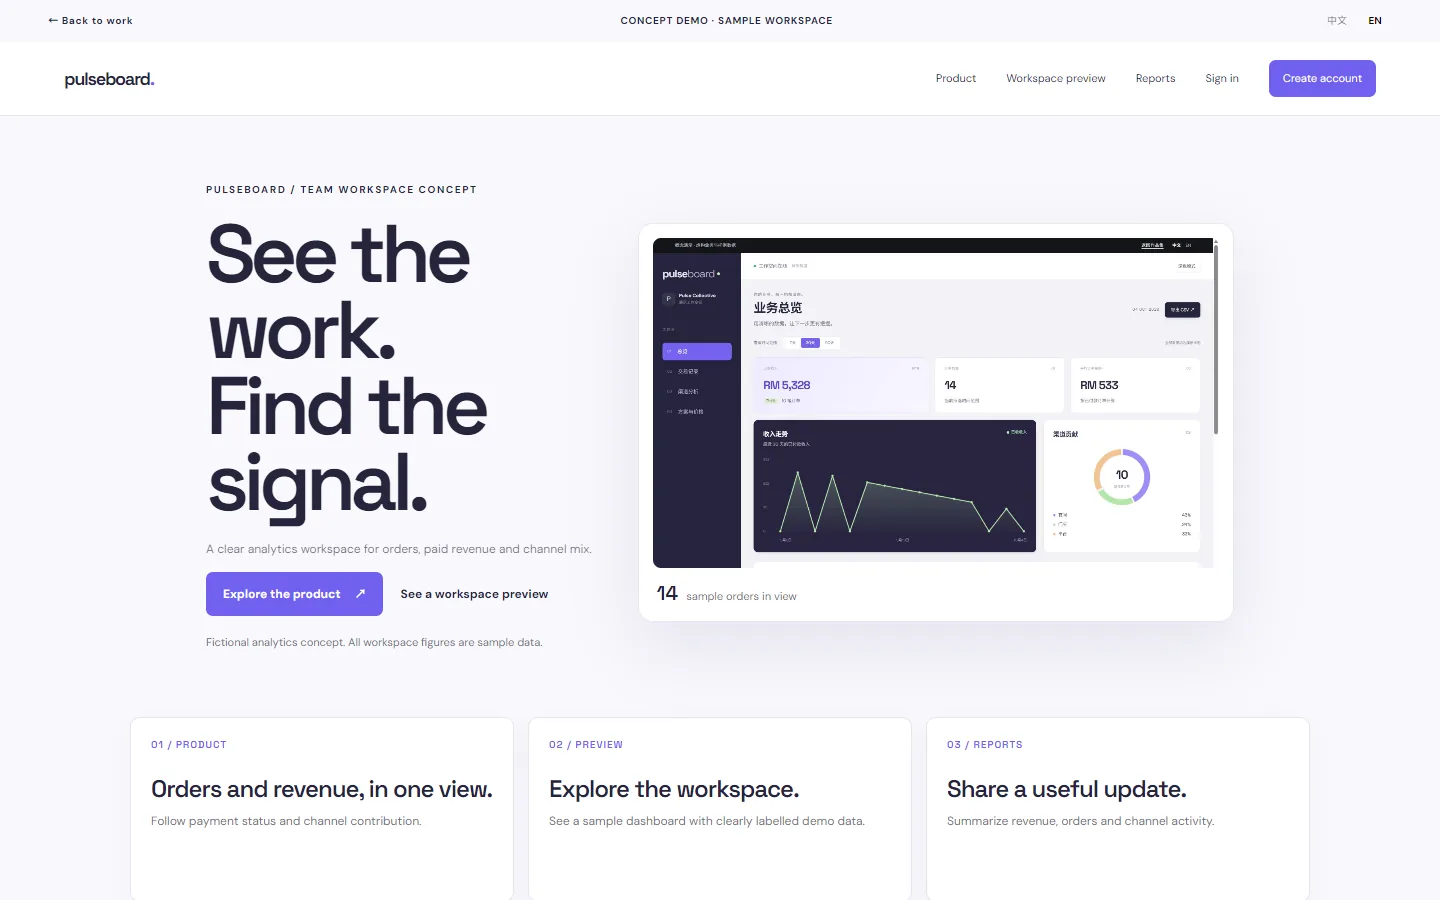
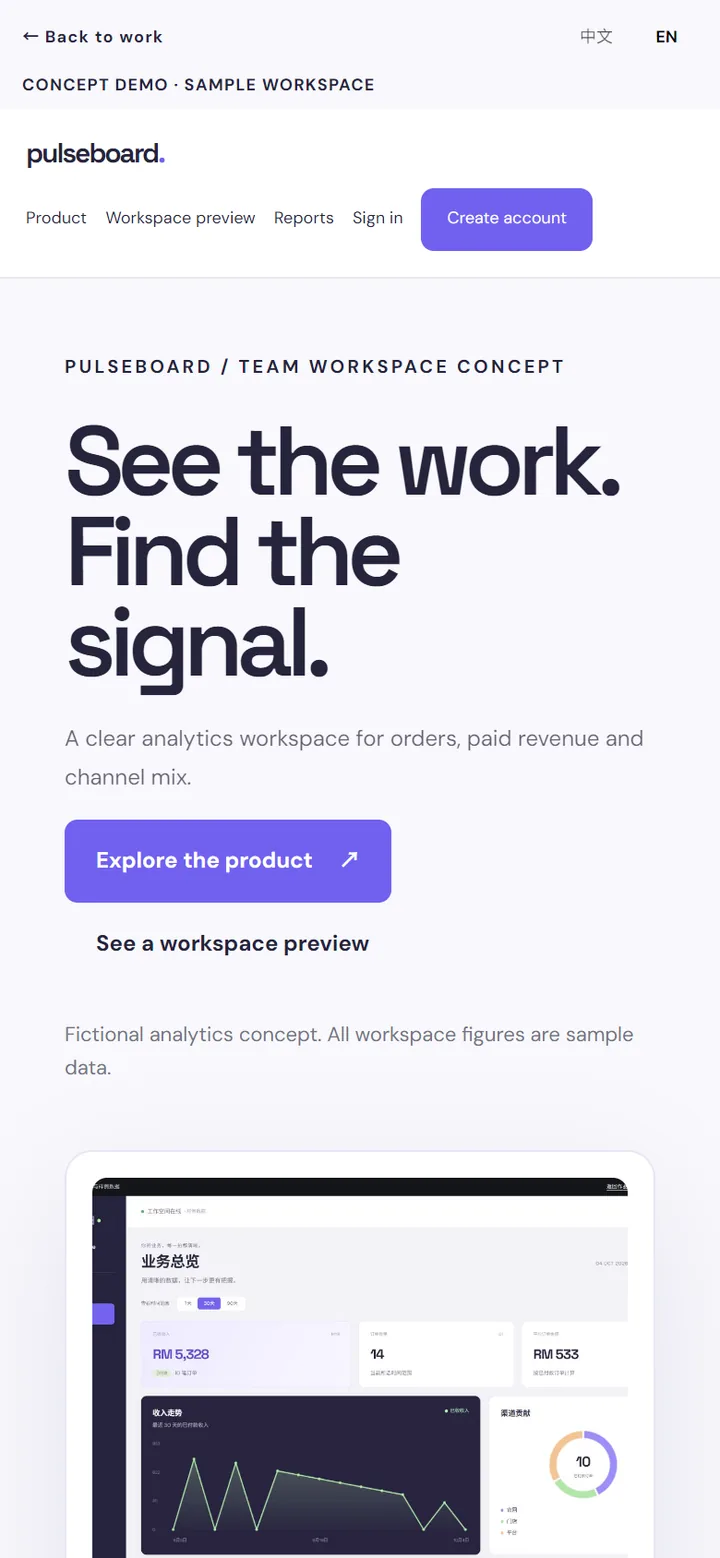
A fictional analytics product concept for reviewing sample orders, paid revenue and sales-channel contribution.
Try it: Filter sample orders and export a CSV.
Open the live demo — PULSEBOARD
01 / Use case & goal
Use case & goal
For a small business owner or operator who needs a clearer picture of orders and sales activity. The goal is to bring headline measures, transaction records and channel summaries into a workspace that is easy to scan.
02 / Design decisions
Design decisions
- 01
Start with a compact overview
Revenue, order count and average order value set an at-a-glance frame for the sample data.
- 02
Keep the underlying records explorable
Search, status filters, date ranges and sorting connect the summary to individual sample orders.
- 03
Make the output portable
Report views and CSV export show how a future dashboard could support sharing and follow-up analysis.
03 / What you can try
What you can try
- Change the date range and switch between overview, transactions and channel insights.
- Search and filter sample orders, then export the current filtered results as a CSV file.